South Africans can’t drive
A new report revealed that South African drivers are among the worst in the world, as the country struggles with a high death rate, poor traffic management, and dangerous roads.
In its 2025 World’s Best Drivers Index, car insurance experts at the Australian company, Compare the Market, looked at the best and worst countries in the world for drivers. To create its ranking, 56 countries were analysed using five key factors:
- Road deaths per 100,000 people
- Legal Blood Alcohol Concentration (BAC) limits
- Average speed limits across highways, as well as rural and urban roads, in kilometres per hour
- Quality of the roads, on a scale of one to seven
- Traffic index score, where a higher score reflects more congestion and inefficiency
They pulled all of these factors to create a combined composite score out of 100 for each country and identify the best countries for drivers and, on the other end of the scale, the worst or most dangerous places to drive in the world.
Home to canals, windmills, and sprawling fields of rainbow tulips, the Netherlands was ranked the number one country to drive in.
With well-maintained roads, reasonable average speed limits and relatively low congestion, driving in the Netherlands is a breeze, Compare the Market said.
This is especially true for drivers outside of city centres. As such, the country earned the highest score of 84.88 out of 100.
Estonia came in a close second, with strong infrastructure supported by the lowest traffic index score on the list.
As one of the least populous European countries, with just 1.3 million people, it’s perhaps not surprising that its roads are safer than those of busier countries. Its total score out of 100 was 81.93.
The legal BAC limit is just 0.02% and the projected road deaths are 2.1 per 100,000 people, among some of the lowest on the list.
Japan and Sweden came in third and fourth, respectively, standing out for their high road quality and low fatalities.
While Japan does have a high traffic index score, its average speed limit is just 70km/h, the lowest on the list, and its composite score was very close to Estonia’s at 81.29 out of 100.
Impressively, Iceland had zero predicted road deaths and fared well with an overall score of 70.60 out of 100
The worst countries for drivers
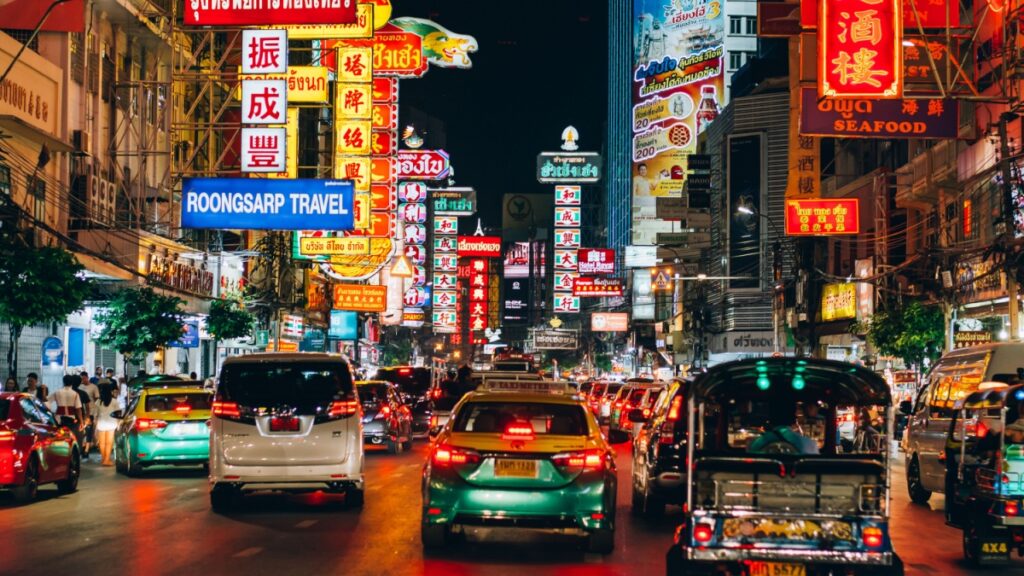
Thailand fell into last place on Compare the Market’s list, with the third-highest rate of road deaths by country at 30.7 per 100,000 people. This score was only outdone by Vietnam at 38.5 and Saudi Arabia with 53.8.
Data from the Asian Transport Observatory revealed that in 2021, 3.5% of all deaths in Thailand could be attributed to road crashes.
Known for its beautiful beaches, delicious cuisine and rich culture, Thailand is unfortunately also home to heavy congestion, especially in and around Bangkok. It scored just 43.83 out of 100 overall.
Argentina and Indonesia followed close behind, due to a combination of poor road quality and limited traffic regulation enforcement.
Indonesia’s low score comes despite the country’s zero-tolerance policy for any blood alcohol content while driving.
Compare the Market highlighted another interesting country: the United Arab Emirates (UAE). The UAE had zero predicted road deaths, a zero BAC tolerance, and a high road quality score.
However, these factors were offset by high congestion and the fastest speed limits, which average 125km/h, giving them a middling overall score of 65.34 out of 100.
The table below shows the 10 worst countries in the world for drivers, according to Compare the Market.
| Rank | Country | Overall (Out of 100) |
|---|---|---|
| 1 | Thailand | 43.83 |
| 2 | Argentina | 46.21 |
| 3 | Indonesia | 48.10 |
| 4 | South Africa | 48.45 |
| 5 | Vietnam | 49.87 |
| 6 | United States | 50.24 |
| 7 | Malaysia | 51.08 |
| 8 | Iran | 52.76 |
| 9 | Philippines | 52.86 |
| 10 | Saudi Arabia | 52.86 |
South Africa
Compare the Market ranked South Africa as the fourth-worst country for driving in the world. Several factors contributed to its low score.
First, South Africa had a predicted road death toll of 17.9 deaths per 100,000 people. The country also had a traffic score of 48.45 out of 100.
This metric was based on Numbeo’s Traffic Index, which was included as a proxy for system inefficiency and congestion. Higher index scores were interpreted as increased risk exposure due to delays, inefficiencies, and traffic volume.
South Africa’s traffic score indicates that the country needs improvements in traffic management and overall road safety to support a more reliable and secure driving environment.
South Africa’s road quality also stood out, and not in a good way. The country achieved a road quality score of only 4.5 out of 7. This shows that there is room for improvement to ensure safer and more efficient roads.
Interestingly, Compare the Market isn’t the only index which pointed out how unsafe South African roads are in 2025.
Earlier this year, a report released by Zutobi found that South Africa was the most dangerous country in the world to drive in for the second year in a row.
This report analysed countries worldwide based on indicators including motorway speed limits, blood alcohol concentration limits for drivers, and road traffic death rates.
Zutobi revealed that South Africa’s overall safety score decreased by 0.52 from 2023 to a dismal 2.88 out of 10.
One measure used to determine the safety of a country’s roads is the seatbelt-wearing rate, which estimates the percentage of car occupants across both sexes who use a seatbelt while travelling in the front of a vehicle.
This data, which was based on sources including the World Health Organisation and European Road Safety Observatory, found that South Africa had an estimated 31% seatbelt-wearing rate.
Zutobi’s rankings also looked at alcohol usage on the roads by comparing both the national maximum legal Blood Alcohol Concentration (BAC) level for the general population and the number of road traffic deaths attributed to alcohol.
Worryingly, South Africa ranked as the country with the highest rate of alcohol-related road traffic deaths at a significant 57.5%.
It is worth noting, however, that South Africa was the only African country considered by both Compare the Market and Zutobi.
The table below shows how South Africa performed on Compare the Market’s key indicators.
| Metric | Score |
| Road Deaths per 100,000 People (2025) | 17.9 |
| Road Quality (1=Low, 7=High) | 4.53 |
| Legal BAC Limit (%) | 0.05 |
| Average Speed Limits (km/h) | 90.0 |
| Traffic Score | 186.1 |
| Overall (Out of 100) | 48.45 |


Comments