The only area in South Africa where the average person makes over R500,000 a year

Gamagara Local Municipality is the only area in South Africa where the average taxpayer has a taxable income of over R500,000 a year, beating the traditional economic powerhouses of Johannesburg, Cape Town, and Durban.
This was revealed in the annual Tax Statistics report released jointly by SARS and the National Treasury, which details tax-revenue collection and tax-return information for the 2020 to 2024 tax years.
SARS said the objective of this publication is to present comprehensive tax revenue data in a manner that complements and helps contextualise data provided by other publications.
It contains more detailed and varied tax revenue data that complements publications such as the National Treasury’s Budget Reviews and SARS’ Annual Reports.
In the most recent financial year, SARS collected R2.2 trillion in gross tax revenue, an increase of 4.2% from the previous year. After various refunds were applied, the total revenue for the year was R1.74 trillion.
Apart from breaking down the sources of tax revenue between personal income tax (PIT), corporate income tax, VAT, and smaller sources, the publication outlined where the individuals who pay the most tax live.
SARS data on the distribution of taxpayers is unique from other sources as it uses the taxpayers’ place of residence rather than their office of registration.
This provides a more accurate indication of taxpayers’ geographic distribution, which is vital for the National Treasury when allocating resources to provinces and municipalities.
Most of South Africa’s high-income earners still live in Gauteng, where the province’s average taxable income per individual reached R416,000 in the last financial year. The Western Cape was second, at R345,000.
The majority of Gauteng’s richest live within the City of Johannesburg and Tshwane, which have the highest average taxable income per individual.

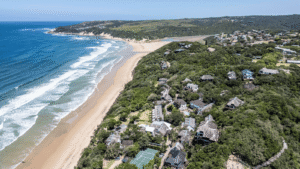
Most of South Africa’s rich elite still live in Johannesburg despite a steady flow out of the city to the country’s coastal regions.
In the past tax year, SARS noted an increase in the number of taxpayers living in the Western Cape and the North-West, while KwaZulu-Natal saw a decline in the number of resident taxpayers.
Gauteng remains South Africa’s economic hub, with the PIT paid in the province at R242 billion, more than triple the second-placed Western Cape’s R76 billion.
This results in the country’s smallest geographical province paying 48.4% of all PIT in South Africa.
However, while Gauteng dominates the absolute PIT paid, individuals in more rural parts of the country tend to have higher average taxable incomes.
This is largely due to their much smaller tax bases, which result in a few high-income earnings pushing up the average taxable income.
For example, the municipality with the highest average income, Gamagara in the Northern Cape, has only 9,703 taxpayers compared to Joburg’s 855,274.
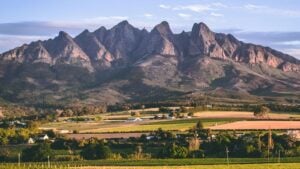
Gamagara Local Municipality boasts the world’s largest single-pit, open-cast iron ore mine and is the starting point of the Sisheng—Saldanha railway line.
The mine is the main reason for the high average income of people living in the Gamagara Local Municipality.
The low number of taxpayers also helps municipalities such as Stellenbosch and Phalaborwa, which have a fraction of the taxpayers Gauteng’s metros have.
Cape Town is disadvantaged by this. The city does not even make it into the top ten municipalities in terms of average taxable income despite its taxpayers contributing R69 billion in PIT to the fiscus.
| Municipality | Taxpayers | Taxable income | Tax assessed | Average taxable income |
| Gamagara | 9,703 | R5.03 billion | R1.26 billion | R518,808 |
| City of Johannesburg Metropolitan | 855,274 | R414.5 billion | R108.6 billion | R484,671 |
| Stellenbosch Local | 31,135 | R14.3 billion | R3.59 billion | R458,198 |
| Joe Morolong Local | 2,166 | R927 million | R215 million | R427,977 |
| City of Tshwane Metropolitan | 658,848 | R272.5 bilion | R61.82 billion | R413,632 |
| Tsantsabane Local | 5,804 | R272.5 billion | R519 million | R405,926 |
| Ba-Phalaborwa Local | 11,275 | R4.56 billion | R971 million | R404,434 |
| Thaba Chweu Local | 11,575 | R4.53 billion | R1.03 billion | R391,015 |
| Thabazimbi Local | 9,574 | R3.7 billion | R809 million | R383,329 |
| KwaDukuza Local | 27,583 | R10.3 billion | R2.36 billion | R374,071 |


Comments