South Africans in these two provinces make the most money

Gauteng and the Western Cape are the only two provinces in South Africa that have a higher GDP per capita than the national average.
This was revealed in Stats SA’s latest StatsBiz publication, which used the country’s latest regional GDP figures.
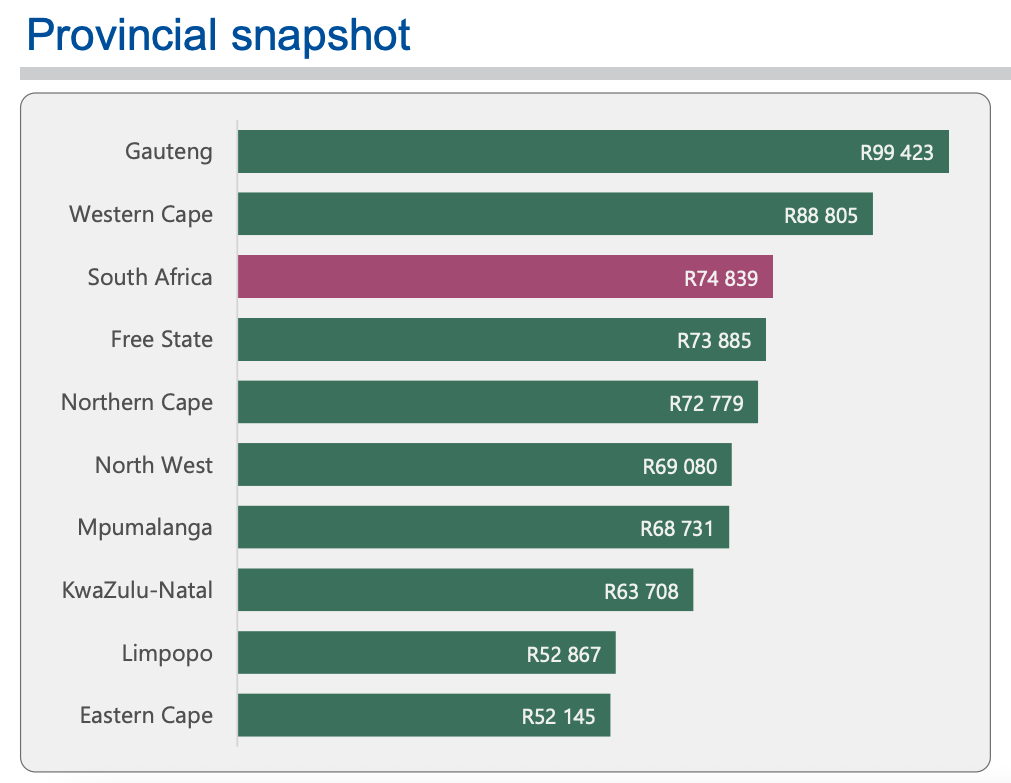
This data showed that GDP per capita in 2024 ranged from R52,145 per person in the Eastern Cape to R99,423 per person in Gauteng.
South Africa’s GDP per capita stood at R74,839, slightly lower than R88,805 in the Western Cape, which follows just behind Gauteng.
The Free State and Northern Cape, in turn, follow the Western Cape, while Limpopo and KwaZulu-Natal are ranked seventh and eighth.
Interestingly, Stats SA pointed out in its mid-year population estimates for 2025 that Gauteng comprises the largest share of South Africa’s population.
Therefore, despite being the smallest province in terms of land area, Gauteng is home to around 16.1 million people (or 25.5% of the population).
KwaZulu-Natal has the second largest population, with an estimated 12.23 million people (19.4%) calling the province home.
With a population of around 1.38 million people (2.2%), the Northern Cape remains South Africa’s smallest province in terms of population. About
Tiny but mighty, Gauteng is considered the country’s economic hub, which explains why its GDP per capita is significantly higher than the rest of South Africa.
Gauteng is not only home to South Africa’s executive capital, but most of the country’s largest corporations are also headquartered there.
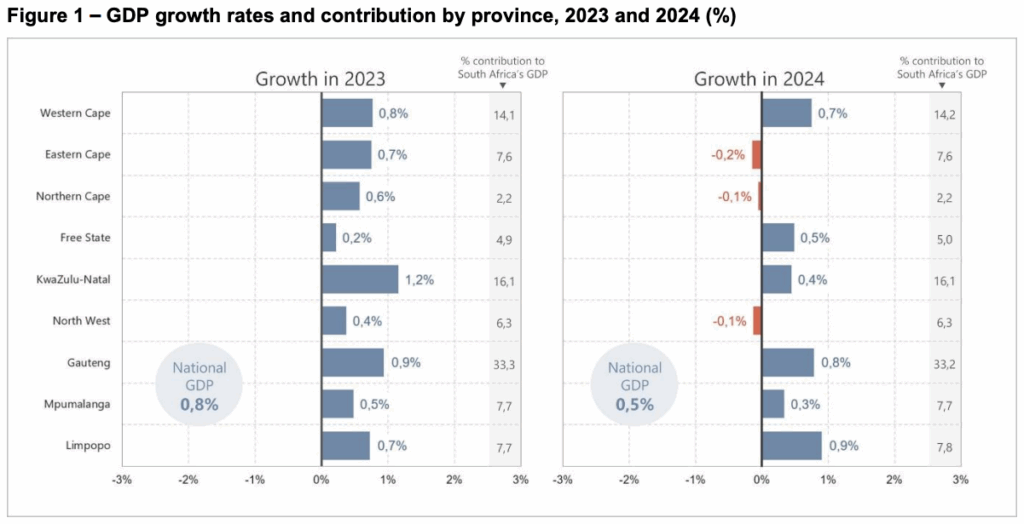
In 2024, Gauteng recorded one of the highest GDP growth rates among the country’s nine provinces, at 0.8%, putting it just behind Limpopo’s 0.9%.
In addition, Stats SA found that Gauteng was by far the largest economic contributor in 2024, accounting for around 33.3% of South Africa’s GDP. This places it far above the Western Cape, which contributed around 14.2%.
The GDP per capita in each province in 2024 can be seen in the graph below, courtesy of Stats SA.
Gauteng vs Western Cape
While Gauteng remains the country’s economic hub, the Western Cape has made several strides in recent years that could see it coming for the crown.
In particular, South Africa’s semigration trend has played a large role in this, as many citizens have moved from Gauteng to the Western Cape in the past few years.
This is due to a combination of the Western Cape’s appeal and Gauteng’s decline, with Johannesburg in particular coming under severe strain.
Wise Move’s 2025 Migration report analysed the cities to which South Africans are migrating and found that 70% of people who move stay within the same province, while 30% migrate between provinces.
While Gauteng saw a high volume of internal migration, it also faced the largest net loss of residents among South Africa’s provinces in 2024.
“It seems that while many South Africans head to Johannesburg to launch their careers, most eventually move on,” Wise Move said.
“This high turnover reflects the province’s dense population, dynamic job market, and fast-paced urban development, where career shifts, housing demands, and lifestyle changes drive constant internal relocations.”
This was not the case for the Western Cape, which emerged as the biggest winner in inter-provincial migration.
In other words, when people were picking a different province to go to, the Western Cape was usually at the top of the list.
The number of people who moved out of the Western Cape was also far lower than the people who moved to the province during the year, a trend which no other province observed.
“With 32.4% of all inter-provincial moves headed to the Cape, it has also retained its talent, contributing only 15.1% to out-migration to a different province,” Wise Move explained.
“This shift hints at changing economic dynamics, with lifestyle preferences, remote work opportunities, and emerging economic hubs drawing talent from Gauteng to the coast.”
The economic contributions from South Africa’s nine provinces can be seen in the graphs below, courtesy of Stats SA.


Comments