Western Cape leaves all the other provinces in the dust

South Africa’s housing recovery remains uneven, with the Western Cape continuing to outperform all other regions through faster sales, stronger price growth, rising building activity, and robust home loan approvals.
According to FNB’s latest Property Barometer, the Western Cape remains the most active region in the country’s property market.
In the fourth quarter of 2025, activity levels increased sharply to 7.1 out of 10, up from 6.2 in the third quarter. Selling times also dropped to an impressive average of 6.2 weeks.
FNB also evaluated the performance of three other provinces – Gauteng, KwaZulu-Natal (KZN), and the Eastern Cape.
These areas also showed improvements in the fourth quarter. Gauteng, for example, showed a resilient recovery with 85% sentiment – even higher than the 65% sentiment recorded in the Western Cape.
However, properties were much slower to move in the country’s other major residential markets. In KZN, properties spent an average of 9.4 weeks on the market.
In Gauteng, properties sold in an average of 13.6 weeks, which is more than double the selling time recorded in the Western Cape.
The table below shows how the four provinces compared in FNB’s Property Barometer for the fourth quarter of 2025 based on activity, sentiment, and selling time.
| Region | Activity | Sentiment | Selling Time (weeks.days) |
|---|---|---|---|
| Western Cape | 7.1 | 65% | 6.2 |
| Gauteng | 6.1 | 85% | 13.6 |
| KwaZulu-Natal | 6.0 | 60% | 9.4 |
| Eastern Cape | 6.5 | 68% | 13.1 |
BetterBond’s February 2026 Property Brief also showed the Western Cape’s dominant performance on the property market in 2025.
It highlighted the province’s performance in three categories: average home price, home loan approval rate, and value of building plans approved.
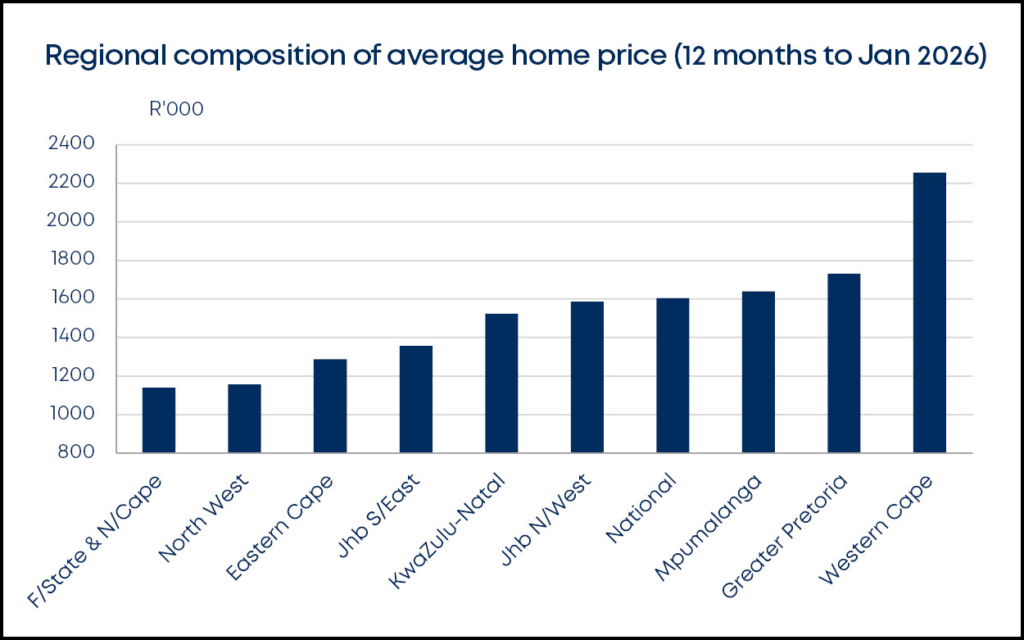
In terms of average home prices for the 12 months to January 2026, Mpumalanga and the Western Cape were tied for first place. Both provinces recorded annualised increases in average home prices of 7.2%.
BetterBond noted that this also represents an impressive real increase, after inflation, of 3.2% on average for 2025.
KZN was the only other region to have recorded a meaningful real growth rate in average home prices, although the North West and Greater Pretoria witnessed average price increases of marginally above 3%.
Looking at real property prices, the Western Cape remained way out in front, with an average home price of R2.26 million in 2025. Greater Pretoria followed, with an average price of R1.73 million.
Positively, the only regional decline in average home prices was recorded in Johannesburg’s North Western suburbs.
Loan approvals and building plan approvals
BetterBond also looked at formal loan approvals in 2025, which showed solid increases across the country. In fact, Mpumalanga was the only region to experience a modest decline over the 12-month period.
The national average approval rate was 63.5%, up 3.8% year-on-year. Greater Pretoria was in pole position during the past 12 months, with an approval ratio of 73.3%.
The Western Cape came in second, with an approval rate of 70.4% – well above the national average. KZN recorded the highest year-on-year rate of increase in the approval ratio, namely 6.3%, with a ratio of 68%.
According to BetterBond, recent improvements in banks’ loan impairment metrics have contributed to higher home loan approval ratios.
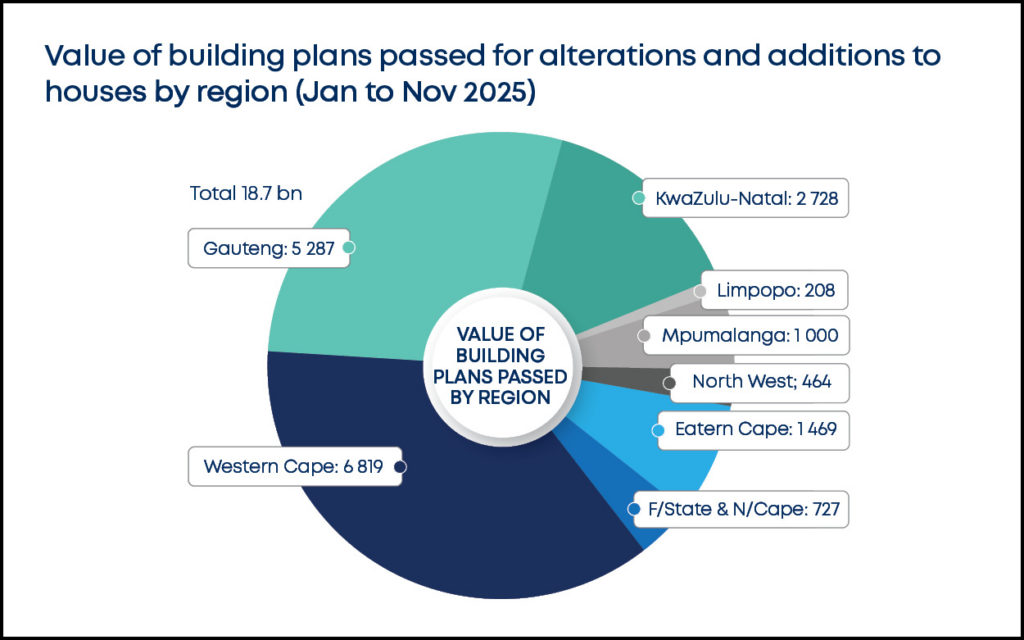
The Property Brief also compared the value of building plans passed for alterations and additions to houses by region in 2025.
Expenditure continued to account for a significant share of the value of building plans approved by the metros and larger municipalities.
During the first 11 months of 2025, it reached an average monthly value of R1.7 billion – marginally higher than the previous year.
However, compared to the period prior to 2023, building plans for house alterations took a turn for the worse, both in absolute terms and relative to total residential building plans approved.
Even so, during 2025, the Western Cape consolidated its number one position for this indicator, also in terms of the year-on-year rate of increase.
The Eastern Cape recorded the second-highest year-on-year growth rate in the value of plans passed for alterations and additions, at 15.2%.


Comments