Good news for South Africa’s property market

South Africa’s housing market is showing a broad-based recovery, with price growth strengthening across regions and property types.
Pam Golding Property Group CEO Dr Andrew Golding said that, encouragingly, from an investor and homeowner perspective, the national recovery in house prices is evident across all three major regional housing markets.
The Western Cape has led the recovery, as the province continues to register the strongest price growth.
According to the Pam Golding Residential Property Index, the top price band continues to register the strongest growth in prices for the fourth consecutive year.
Year-to-date, house price inflation (HPI) for homes over R3 million has averaged 4.96% (January to October 2025). The slowest growth has been recorded by homes priced below R1 million at 2.31% during the same period.
While the recovery in the revised national HPI continues to gather momentum, the uptick in the consumer inflation rate to 3.6% in October 2025 resulted in the real (inflation-adjusted) HPI easing to 0.2% in October 2025.
This marked the eighth consecutive month in positive territory. While the current recovery in the national housing market started in the Western Cape, it has become more broad-based.
In the year to date, Golding noted that all provinces are now registering positive growth in house prices. Notably, despite accounting for just 1.3% of total national sales by value, house prices in Limpopo are soaring.
In this regard, for the year to date, Limpopo is second only to the Western Cape among South Africa’s regional markets.
Golding explained that the growth in coastal house prices appears to have slowed, peaking at 5.7% during the past three months. Meanwhile, non-coastal HPI continues to gather momentum, rising to 3.9% in Oct 2025.
As a result, the coastal price premium narrowed to 1.8% in November. Lightstone defines coastal properties as those located within 500 metres of the coastline.
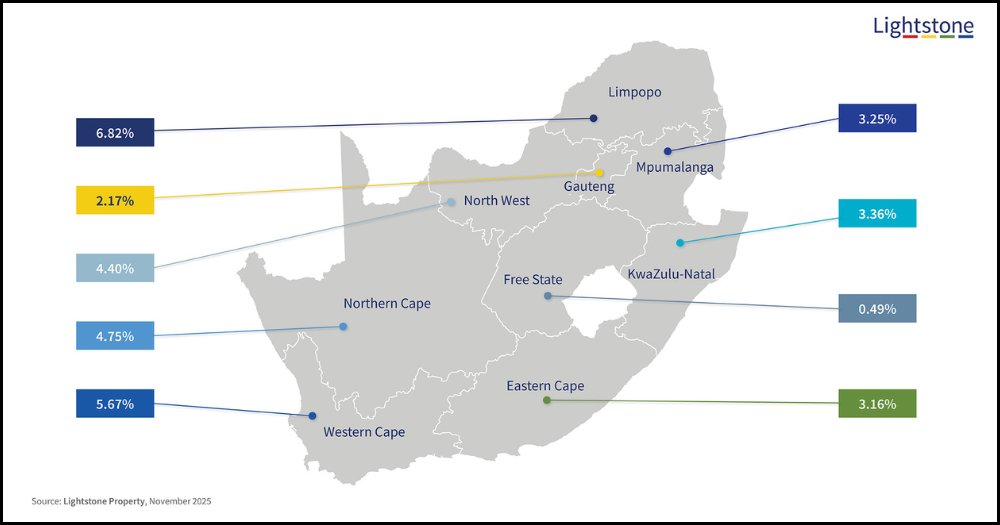
The graphic below shows Lightstone’s HPI index across all nine provinces.
HPI in South Africa’s metros
“Among metro housing markets, Cape Town was the first to recover,” he said. “While it remains the primary engine of the recovery, Tshwane is also making a solid contribution, and the recovery has now spread to all metro markets.”
“Year-to-date, Cape Town continues to outperform other major metro housing markets in terms of HPI by a wide margin.”
According to Golding, Cape Town’s continued outperformance reflects ongoing demand and an intensifying shortage of supply, despite ongoing development.
“Demand for residential property in Cape Town is being reinforced by ongoing, albeit slower, semigration, and brisk investment demand,” he said.
On the other hand, he noted that two of Gauteng’s three metro markets – Johannesburg and Ekurhuleni – continue to lag on the HPI front.
Even so, Golding said market activity in Gauteng is showing healthy resilience, with renewed buyer interest suggesting that 2026 may bring a steadier period of growth for the region.
Within Gauteng, HPI in Tshwane continues to outperform relative to the two other metro housing markets. Prices are strengthening in all three coastal metro markets.
“While national volumes have not fully recovered to pre-2008 levels, the Western Cape has registered a recovery in sales volumes based on a 2008 benchmark,” Golding said.
While it is already evident that the region is outperforming in terms of price, it is also clear that the influx of semigrants is indeed significantly impacting activity too, he added.
“The Western Cape continues to attract more people than it loses, driven by lifestyle security, better governance, and quality of life,” he explained.
“However, the pace of inward migration has slowed compared to previous years due to soaring property prices, increased congestion, and challenges like long school waiting lists in Cape Town and its immediate suburbs.”
Even though most positive changes are still from the Western Cape, Golding reiterated that Limpopo has also shown gains.
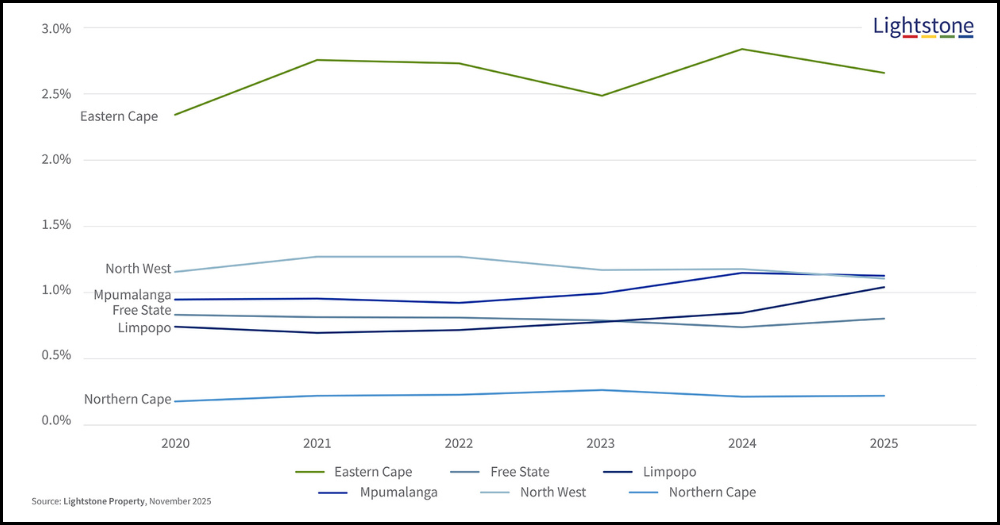
The graph below shows how the other six provinces compare on sales above R3 million.


Comments